Anecdote or Dataset: What Each Can Tell You
Anecdote or dataset: learn how personal accounts and collected observations shape a public claim, and decide what each can responsibly tell you.
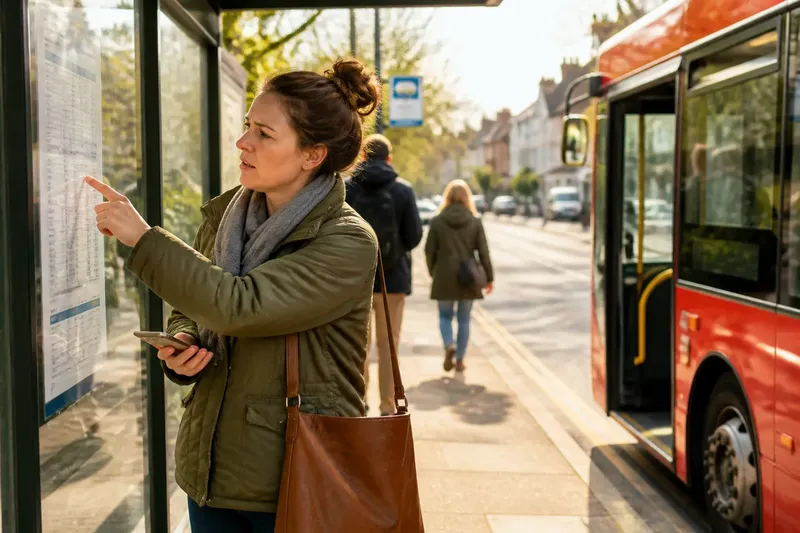
Anecdote or dataset is a choice that changes how a public claim lands: a passenger’s account can show what a bus timetable felt like in practice, while service records can describe patterns across recorded journeys. Neither format automatically tells you which concern deserves attention; each makes some details easier to see and others easier to overlook.
To read them well, notice how a story selects a person and a moment, and how a dataset selects categories and cases. Those choices shape the picture before anyone draws a conclusion from it.
Stories make particular experiences visible
An anecdote describes a specific person, event or experience. Its detail can reveal how a policy or service meets someone in daily life: the missed connection, the confusing form, the unexpected delay. That can expose a consequence that an official category does not record.
Suppose a resident says a revised bus timetable made it harder to reach an evening shift. The account may prompt a reporter to check the route, departure times and available alternatives. It establishes that the resident describes this difficulty; it does not, by itself, show how many other workers face it or what caused it.
How the account is framed matters. “One passenger says the new timetable disrupted her journey” keeps the focus on a reported experience. “The timetable is leaving workers stranded” turns that account into a wider claim, which needs support beyond the single story.
Context helps readers understand the account without making them responsible for disproving it. Was the route changed? What time was the journey? Were there other disruptions? Such details can sharpen the public question while leaving the person’s account intact.
Datasets make some patterns easier to see
A dataset gathers observations according to chosen rules. It could contain survey replies, service records, inspection notes or local-authority counts. The format helps readers compare cases, but its categories determine which differences can appear on the page.
For example, a record that marks a bus as “arrived” may not say whether it had space for a wheelchair user or arrived at a useful time. The recorded category is not the same as the full journey. Averages can likewise make a general pattern visible while leaving a difficult experience in a smaller group out of view.
Selection happens before analysis. A survey of people who chose to reply describes those replies; it may not capture people who ignored the invitation. A count from one route or period cannot quietly stand for every route or season. Check what the collection includes, how its categories were chosen and what its boundaries leave out.
A dataset is like a paper map: useful for seeing certain routes and landmarks, but it cannot show every feature of the place. The map’s omissions are not necessarily errors; they matter when someone treats it as the whole terrain.
Ask what the pairing puts in the foreground
News reports often place a vivid account beside a table or survey result. The pairing can help readers connect a public issue to ordinary life, but it can also make one person appear representative or make a broad average seem to settle every individual concern.
Look at the editorial choices: who was invited to speak, which account leads the story, what categories appear in the graphic, and which voices or outcomes are absent. A dramatic case may attract attention without being typical. A broad total may be accurate while obscuring a serious problem for a particular group.
Imagine a hypothetical report about evening library visits. It opens with a librarian’s account of quieter evenings and includes visitor records from before and after a change in opening hours. The records could show fewer recorded visits in the periods compared, but the report would still need to explain whether the same branches and counting rules were used; if they were not, the comparison is less direct. Even with consistent records, the sequence alone would not show that the changed hours caused the decline.
In this example, the story gives the change a human setting and the records provide a broader count. Neither should be made to answer a question it was not designed to answer. Readers can ask whether the report treats the account as illustration, evidence of a particular experience, or proof of a wider pattern.
Check how stories and datasets frame a claim
Can a personal account show a wider pattern?
It can draw attention to a possible pattern, but a single account cannot tell readers how common that experience is. The account can still matter on its own, especially if it reveals a consequence that a report’s categories miss.
Does a larger dataset settle a public argument?
Not on size alone. A large collection can still leave out relevant people or record an outcome too narrowly to answer the question being asked.
What should I check in a survey report?
Look for who was invited, who responded, how questions were worded and how answers were grouped. Then compare the report’s conclusion with the people and answers it actually describes.
Why might a story and a dataset seem to disagree?
They may cover different places, periods, groups or outcomes. A person’s account can describe a real experience that is uncommon in the wider count; first check whether both sources are addressing the same part of the issue.
Use a quick framing check before sharing a claim
Before sharing a story, chart or headline, note what each source puts in view and what it leaves outside the frame. For each item below, the possible observation leads to a practical next decision:
- Who is speaking? If the account comes from one person, describe it as an individual experience; if several voices are presented, check how they were selected before calling them representative.
- What does the dataset count? If its category matches the outcome in the claim, use that narrow description; if it does not, avoid treating the count as a measure of the broader experience.
- Who is missing? If the report explains which people or cases are absent, keep the claim within that boundary; if it does not, look for the collection method or state that coverage is unclear.
- Do the sources cover the same place and period? If they do, compare them cautiously; if they do not, present them as separate views rather than direct confirmation.
- Is the account selected for its drama? If the report offers no reason to treat it as typical, call it an illustration; if it provides a selection method, explain what that method can and cannot represent.
- Does the headline imply cause? If the evidence only shows that one event followed another, describe the sequence; if the report supplies further support for causation, summarise that support without stretching beyond it.
- Does a broad total hide a group’s experience? If the report breaks results down by relevant groups, check those details; if it gives only an overall figure, avoid claiming that every group had the same experience.
Anecdote or dataset is not a contest in which one must defeat the other. A person’s account can make a neglected consequence visible, while a carefully described collection can show whether the issue appears beyond that single encounter. The useful editorial question is what each format places in the foreground—and whether the final claim leaves room for what it leaves out.